
 Community
 Video Library
 Agent Training
 Freshservice
 Freshdesk
 Freshchat
 Freshcaller
 Freshsales
 Freshteam
 Freshworks Neo
 Freshsurvey
 Growth
 Free
FreeTABLE OF CONTENTS
This article provides information about the Chat AI Agent Performance Report, including its widgets, metrics, and trends.
Prerequisites
Before you access the report, ensure that you have the following:
- An active Freshdesk or Freshdesk Omni account with access to AI Agent Studio.
- Administrator access to AI Agent Studio and Analytics.
- At least one Chat AI Agent configured and deployed.
- Conversations processed by the AI Agent during the selected reporting period to view performance data.
Note: The report displays data based on the selected date range and available conversation activity. Some widgets might not display data if there is insufficient activity.
Overview
The Chat AI Agent Performance Report provides insights into conversation insights managed by the AI Agent. It consolidates conversation metrics, resolution outcomes, channel distribution, customer feedback, topic analysis, knowledge source performance, workflow performance, and conversation trends in a single report.
The report highlights overall conversation volume, resolutions achieved without human involvement, escalations to human agents, and potential areas requiring optimization.
The report contains three tabs:
- Overview: Provides a summary of conversation performance and outcomes.
- Detailed Analysis: Provides a breakdown of knowledge source performance, workflow performance, and topic distribution.
- Trends: Shows changes in conversation volumes, deflection, transfers, and other performance metrics over time.
Benefits:
Use the report to:
- Measure AI Agent performance: Track conversation volumes, deflected conversations, transfers to human agents, and open conversations.
- Evaluate self-service effectiveness: Understand how effectively the AI Agent resolves customer queries without human intervention.
- Identify content gaps: Find topics that generate conversations but are not resolved successfully by the AI Agent.
- Evaluate workflows and knowledge sources: Identify workflows or knowledge sources that might need configuration changes or content updates.
- Understand customer feedback: Review positive and negative feedback to identify areas where responses need improvement.
- Track performance over time: Determine whether changes to knowledge content, workflows, or AI Agent configuration improve performance.
For more information, see Analyze performance and improve AI Agent.
Report tabs and widgets
The following sections provide detailed information about each tab in the report:
Overview
The Overview tab provides a summary of AI Agent performance. It presents conversation volumes, customer feedback, channel distribution, popular topics, and conversation outcomes.
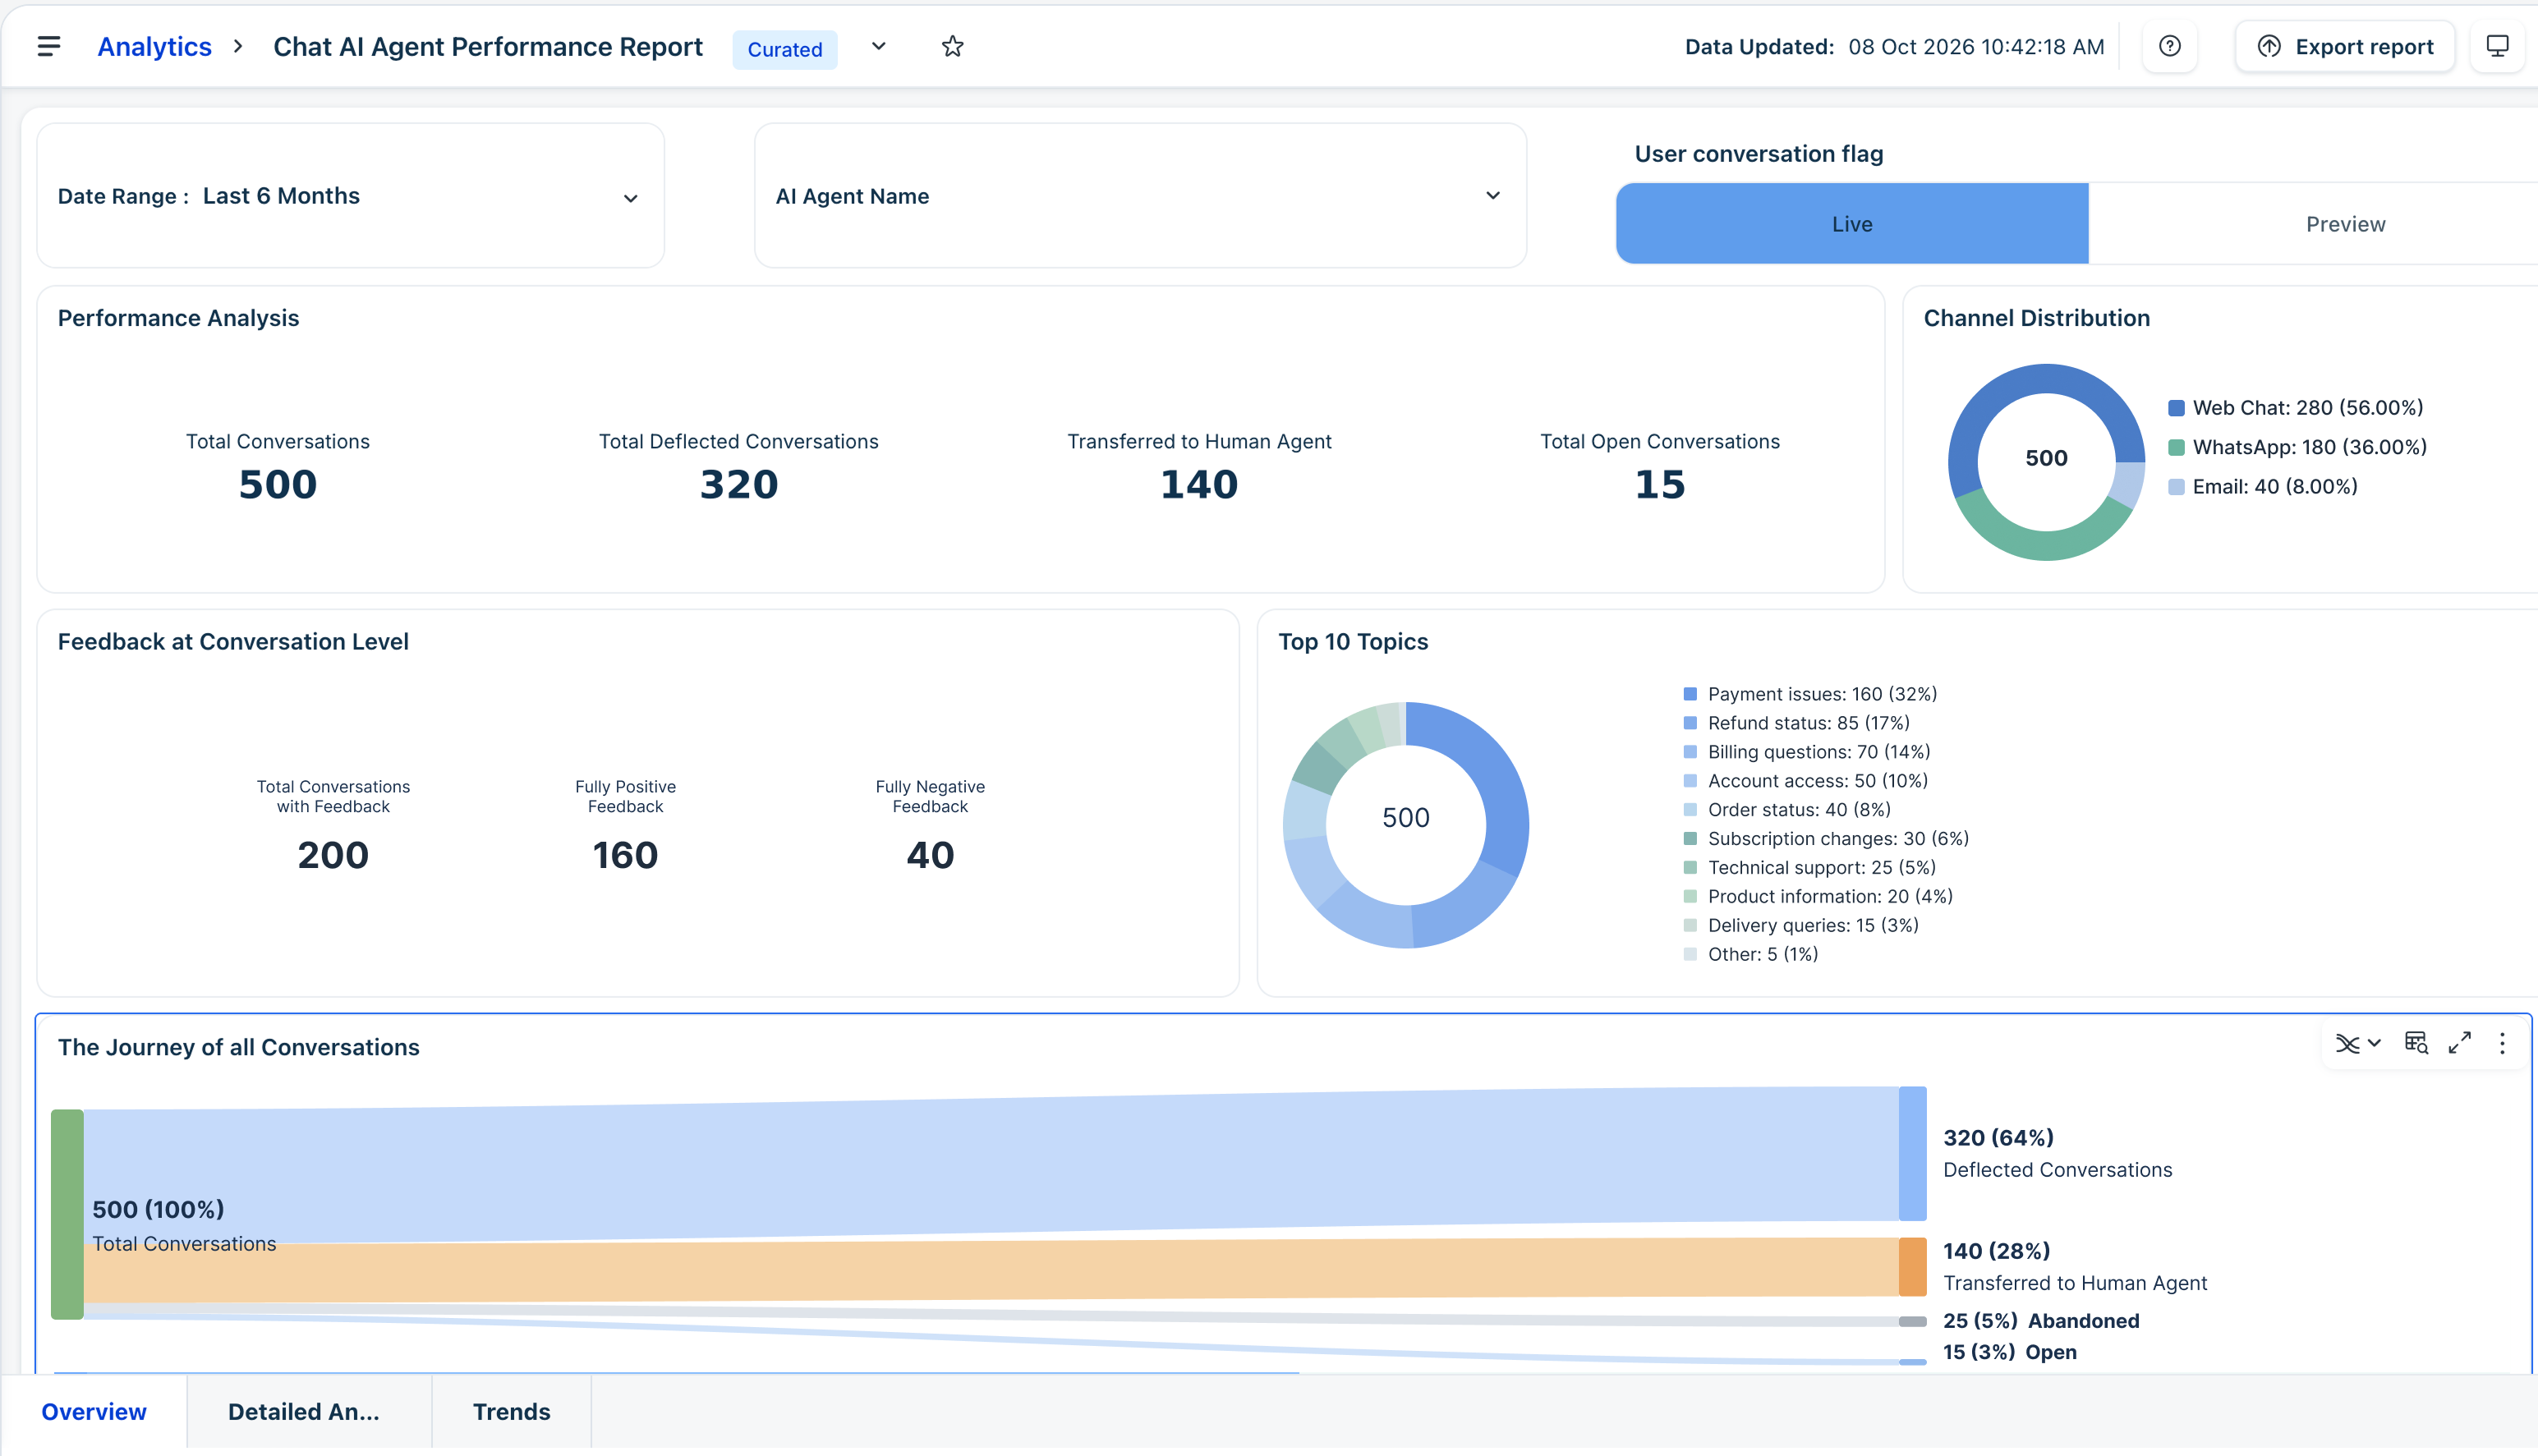
The following table details each widget in the Overview tab and how you can use it:
Widget | Description | How to use it? |
Performance Analysis | Displays total conversations, total deflected conversations, conversations transferred to human agents, and total open conversations. See Understanding performance metrics for details. | Assess the AI Agent's workload, self-service performance, and reliance on human agents. Compare deflected conversations with total conversations to evaluate self-service effectiveness. |
Channel Distribution | Displays the distribution of conversations across supported channels. | Identify the channels generating the most conversations and prioritize channel-specific improvements. |
Feedback at Conversation Level | Displays the number of tickets with feedback, fully positive feedback, and fully negative feedback. | Evaluate customer sentiment and identify potential response quality or resolution issues. |
Top 10 Topics | Displays the most frequently occurring topics in customer conversations. | Identify common customer queries and prioritize knowledge coverage and response improvements. |
The Journey of all Conversations | Visualizes the progression of conversations through outcomes such as escalation, abandonment, assignment to a human agent, and closure. | Identify where conversations leave the self-service journey and assess the need for improvements to resolution, escalation, or engagement. |
Understanding performance metrics
- Total conversations: The total number of conversations handled by the AI Agent during the selected period.
- Total deflected conversations: Conversations resolved by the AI Agent without human intervention.
- Transferred to human agent: Conversations handed over to a human agent.
- Total open conversations: Conversations that remain open during the reporting period.
Example:
The report shows that the AI Agent handled 500 conversations, deflected 320, transferred 140 to human agents, and recorded 25 abandoned and 15 open conversations. Web Chat and WhatsApp account for most conversations, and payment-related queries are among the most common topics.
You can use these insights to identify frequently occurring queries, understand conversation outcomes across channels, and prioritize issues that require further investigation. In this case, the high number of transfers prompts a closer review of payment-related conversations in the Detailed Analysis tab.
Detailed analysis
The Detailed Analysis tab contains three tables that provide insights into knowledge source performance, workflow performance, and the distribution of conversations across topics and subtopics.
Knowledge source performance
This table provides details about the answers generated using individual knowledge source content items and the feedback received for those answers. Use this information to identify content items that might need improvement.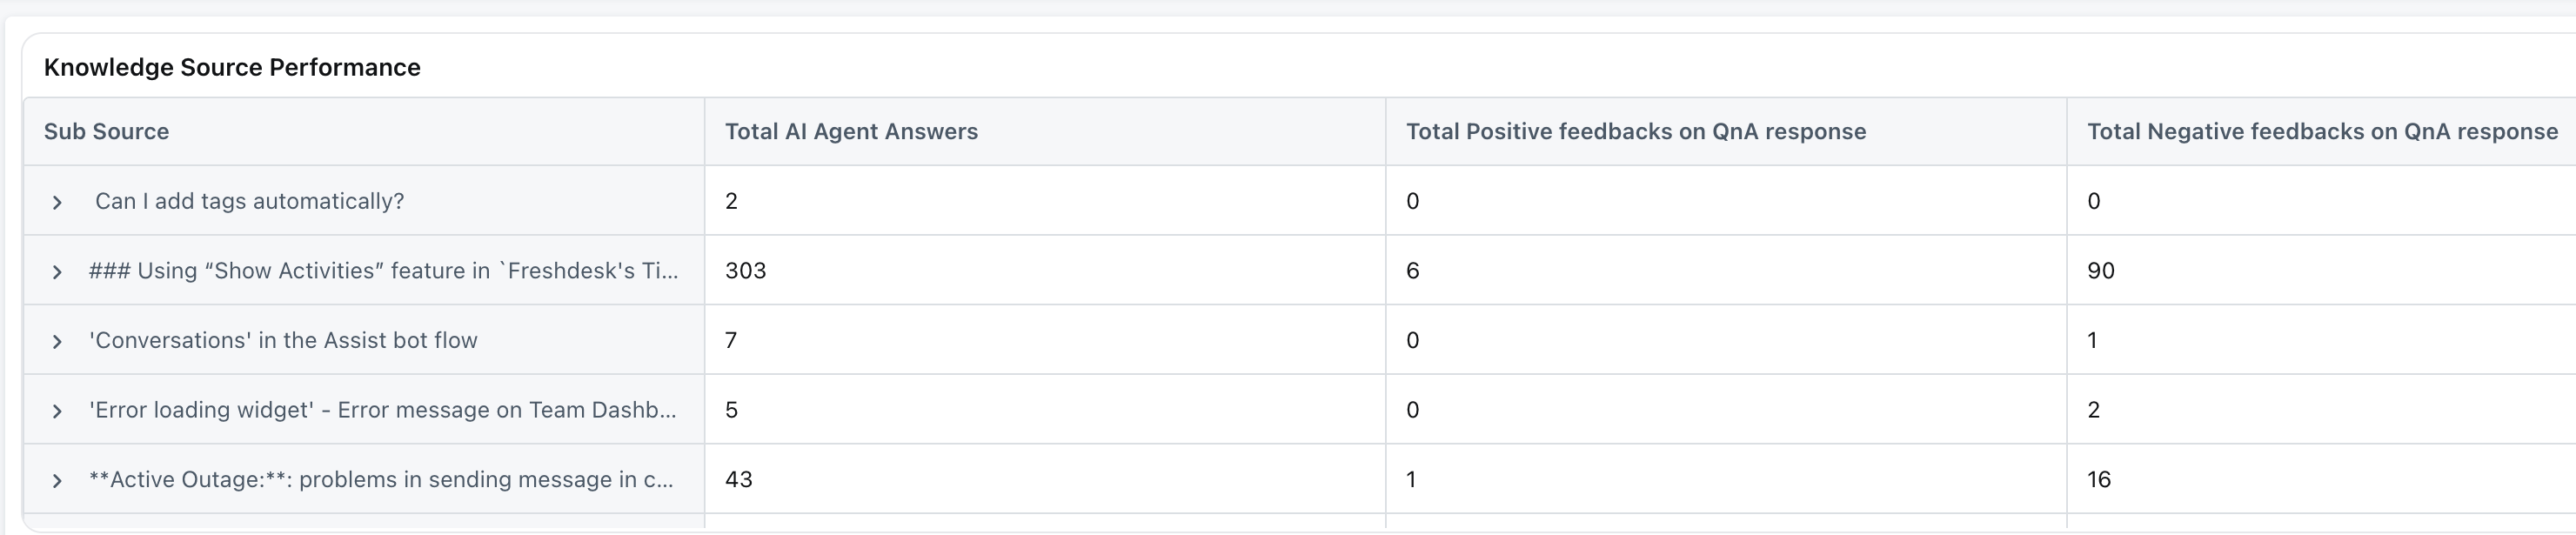
The table contains the following details:
- Sub Source: The name of the knowledge source content item.
- Total AI Agent Answers: The total number of AI Agent answers associated with the content item.
- Total Positive feedbacks on QnA response: The number of positive feedback responses received for answers associated with the content item.
- Total Negative feedbacks on QnA response: The number of negative feedback responses received for answers associated with the content item.
Workflow Performance
The table provides details about the conversations handled by each AI Agent workflow, including completion rates and handovers to human agents. Use this information to identify workflows that might need further investigation or improvement.
 You can see the following deatils:
- Agent Workflow Name: The name of the AI Agent workflow.
- Conversations Handled: The number of conversations handled by the workflow.
- Completion rate %: The percentage of workflow conversations completed.
- Handover %: The percentage of workflow conversations handed over to a human agent.
Topic and Subtopic Distribution
The Topic and Subtopic Distribution table provides a breakdown of customer conversations by topic and subtopic. Use this information to identify frequently occurring topics and prioritize areas for improvement.

The table contains the following details:
- Topic Name: The topic associated with customer conversations. Expand a topic to view its associated subtopics, where available.
- Total Conversations: The number of conversations associated with each topic or subtopic.
Trends
The Trends tab helps you understand how AI Agent performance changes over time. Use it to identify changes in conversation volume, deflection, transfers to human agents, and feedback.
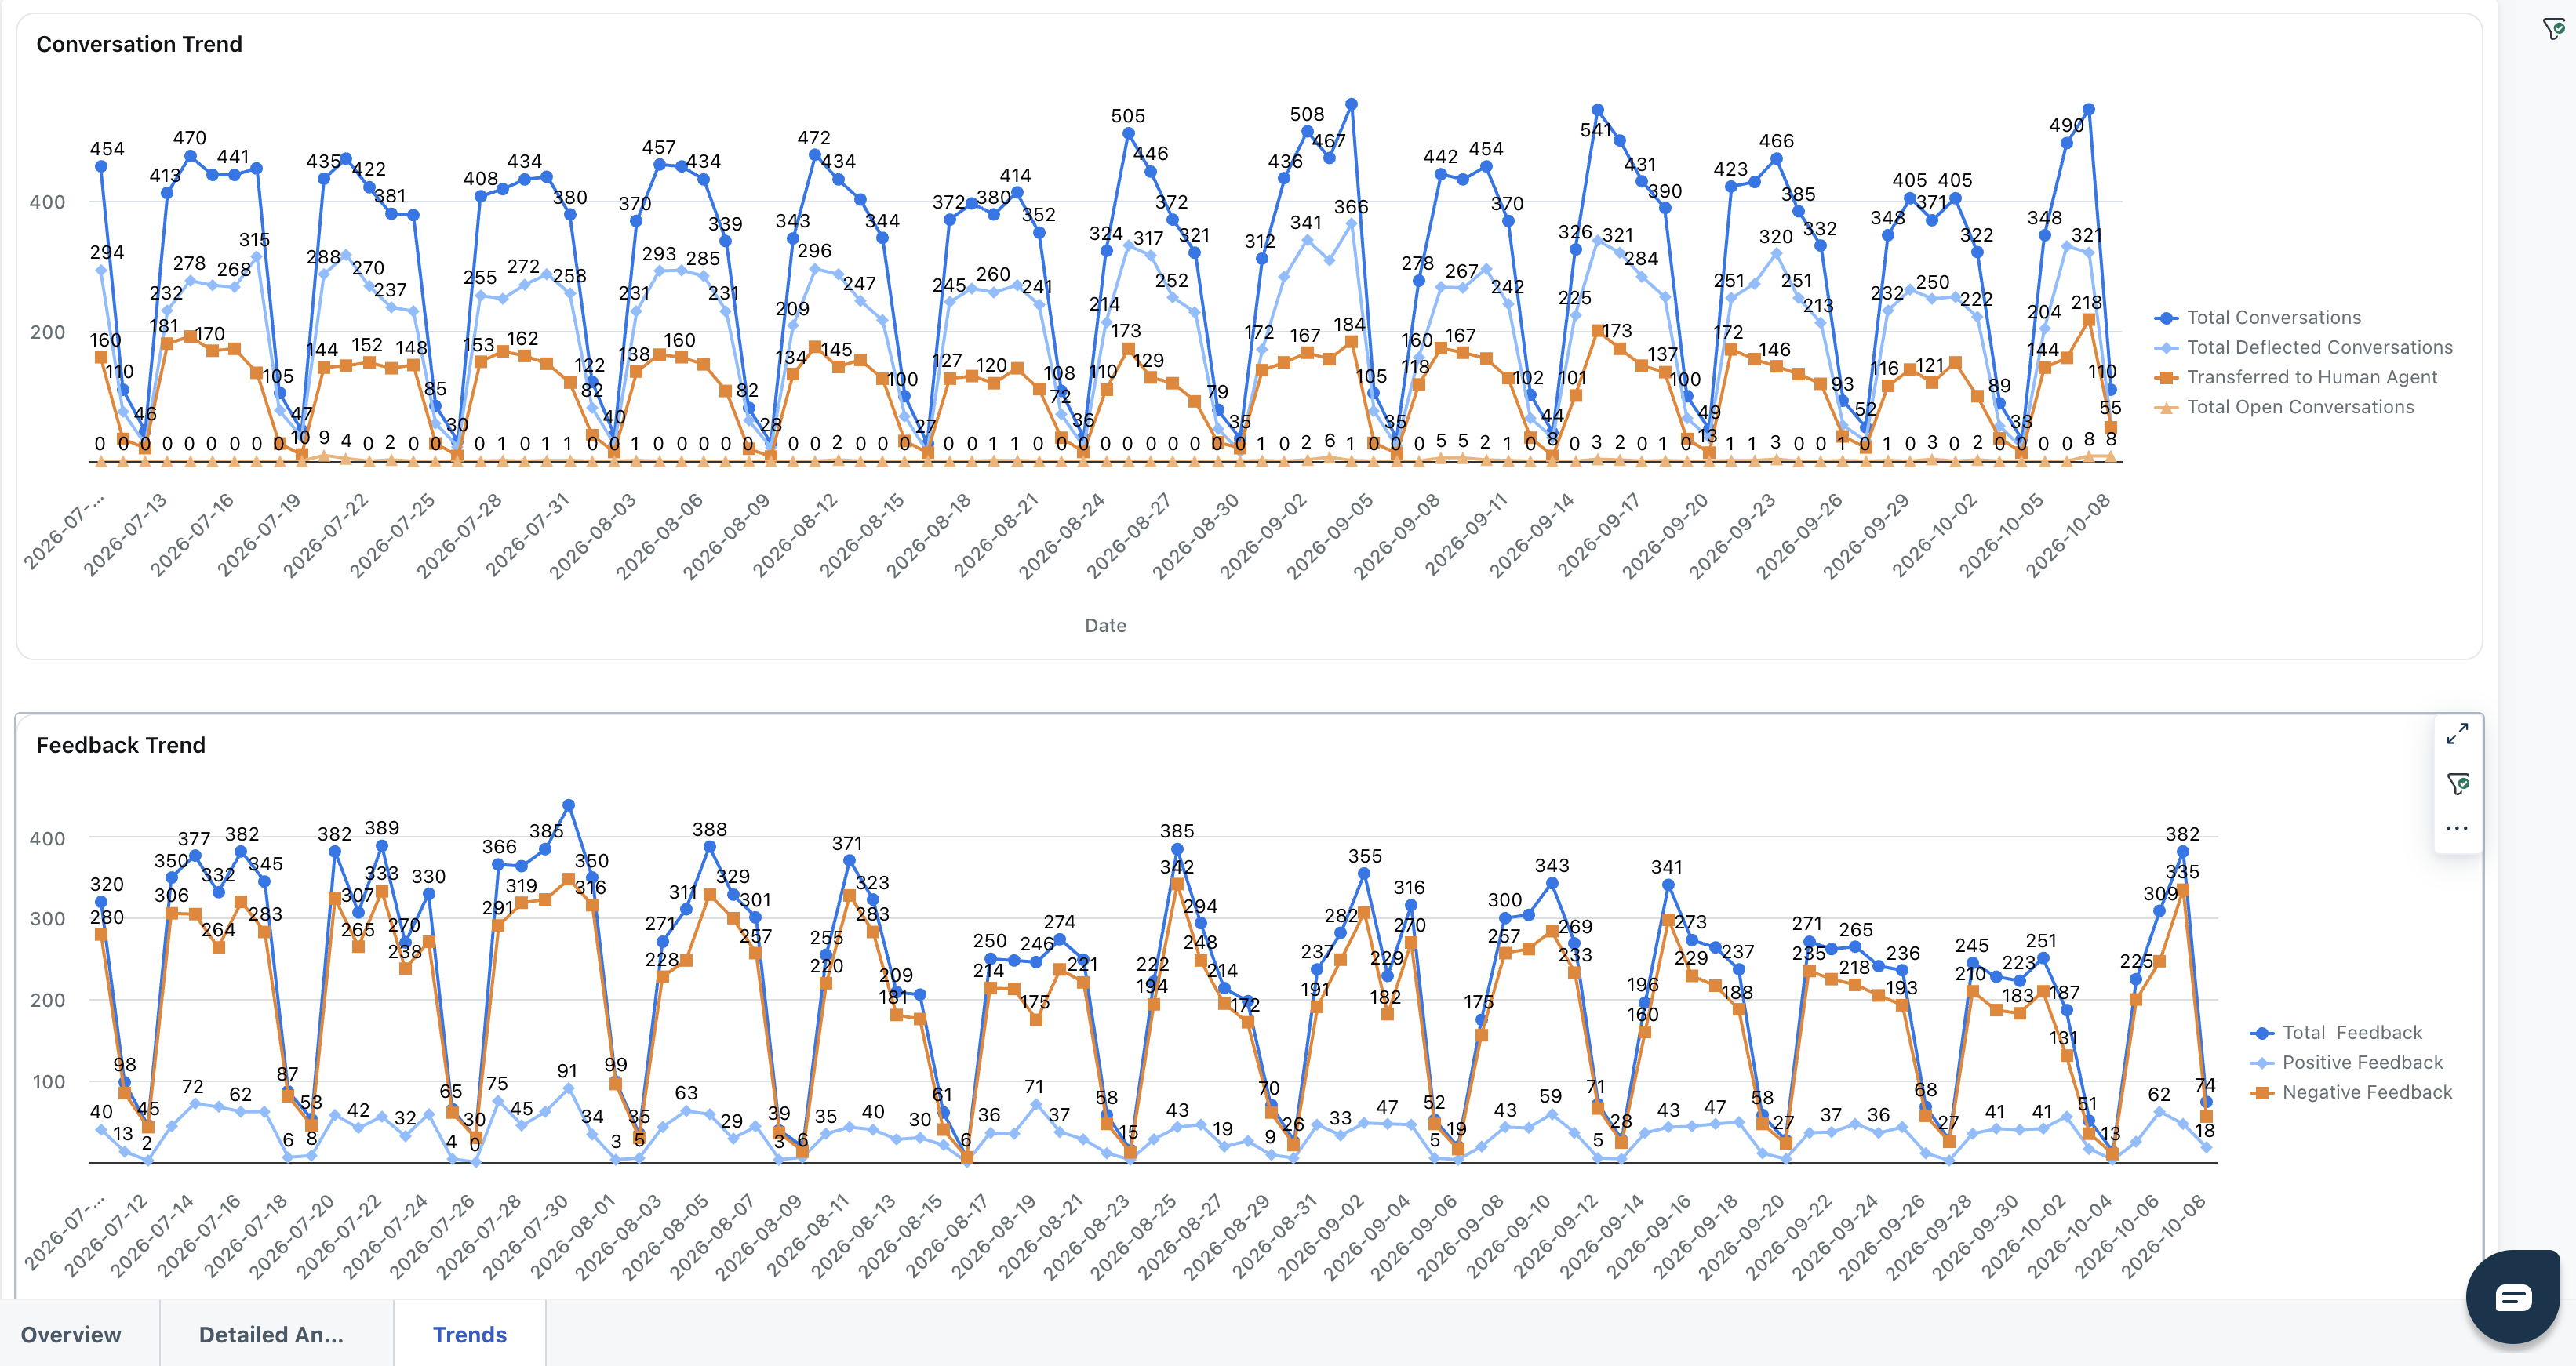
Widget | Description | How to use it |
Conversation Trend | Displays conversation metrics over time, including total conversations, total deflected conversations, total open conversations, and conversations transferred to human agents. | Identify increases or decreases in conversation volumes and resolution outcomes. Correlate significant changes with knowledge base updates, workflow changes, product launches, or other operational changes. |
Feedback Trend | Displays customer feedback trends over time. The widget may display no data if feedback has not been recorded during the selected period. | Monitor changes in customer feedback and investigate periods when negative feedback increases or positive feedback declines. Use the findings to identify potential issues with response quality or the self-service experience. |