A well-structured dashboard provides teams with instant clarity on performance, workload, and trends, eliminating the need to go through multiple reports. In this article, you’ll find a quick overview of each Freshdesk dashboard.
To access the default dashboards,
- Go to Dashboards on the left navigation bar
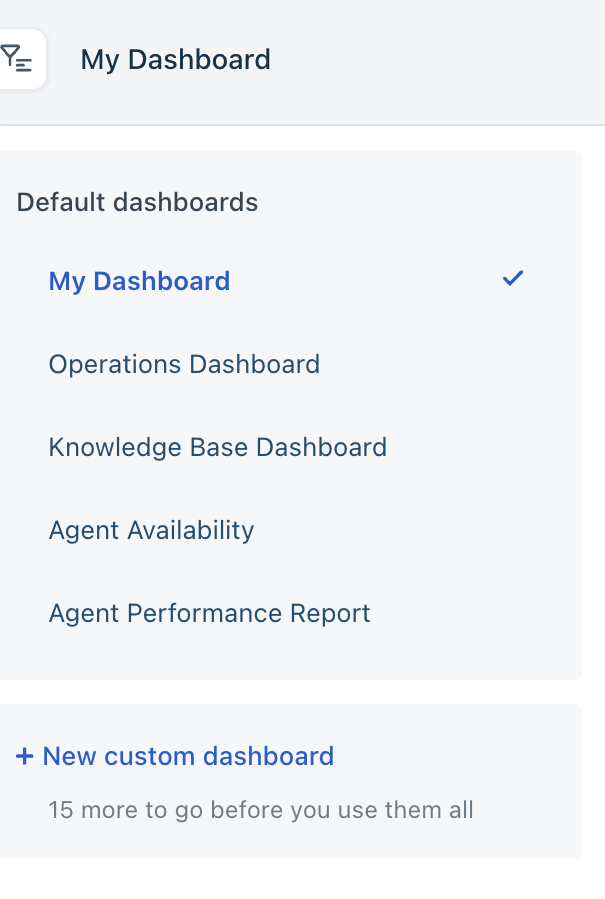
- You have the following default dashboards:
- My Dashboard
- Operations Dashboard
- Knowledge Base Dashboard
- Agent Availability
- Agent Performance Report
Let’s see the default dashboards in detail:
My Dashboard
You can filter the data on top using the following filters:
- Group
- Source
- Product
- Agent Type
- Status
Operations Dashboard
The Operations dashboard gives you a real-time view of ticket volume, SLAs, and agent availability. This helps support teams to monitor day-to-day performance and respond to issues quickly.
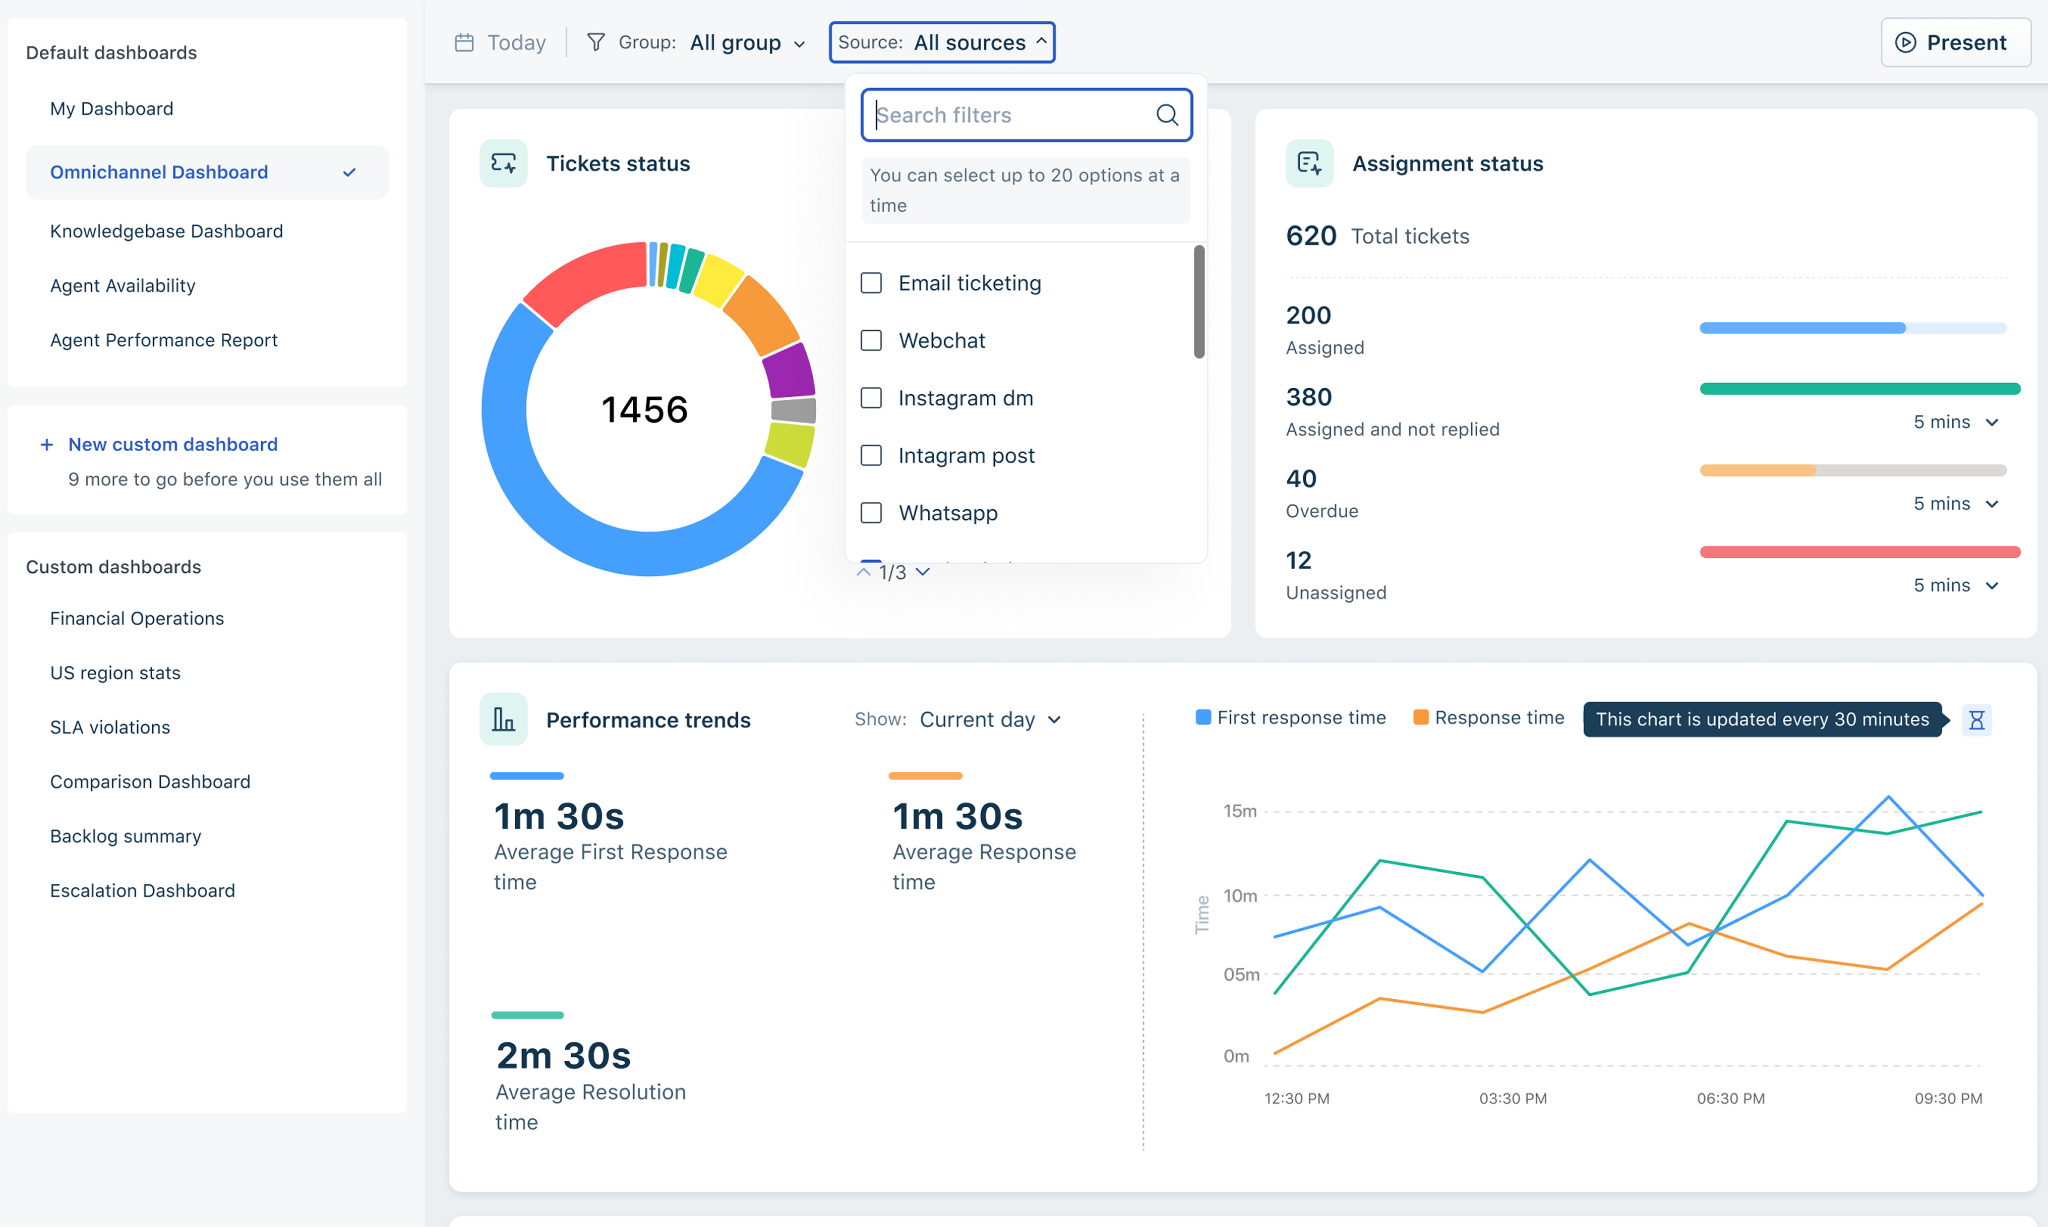
The Operations Dashboard has the following widgets:
- Ticket Status – Displays the distribution of tickets by status (e.g., assigned, open, etc.). You can filter by Current day, last 5 mins, last 15 mins, last 30 mins, last 1 hour.
- Assignment Status – Shows how many tickets are:
- Assigned - Displays the list of assigned tickets
- Assigned & not replied - Tickets that are assigned with no first response yet (can be filtered by 5 mins, 15 mins, 30 mins, 1 hour, and 4 hours). Helps agents adhere to first response time SLAs
- Overdue (can be filtered by the next 5 minutes, 15 minutes, 30 minutes, 1 hour, or 4 hours). Helps agents work on tickets that are at risk of becoming overdue soon.
- Unassigned - Displays the number of unassigned tickets. Can be filtered for the next 5, 15, 30 mins, and 1 and 4 hours)
- Performance Trends – Displays Average first response, response, and resolution times. You can filter by Current day, last 15, 30 minutes, and 1 and 4 hours.
- Incoming Tickets – Tracks new tickets created throughout the day.
- SLA Summary – Displays data on SLA, specifically where targets are met. Includes:
- SLA-compliant tickets
- First response SLA achieved
- Every response SLA achieved
- Resolution SLA achieved

You can filter by the current day, the last 15 minutes and 30 minutes, and the last 1 and 4 hours.
- Agent Availability Snapshot – Displays the number of agents in Available, Unavailable, and Idle states. Click View all to access the Agent availability dashboard for more details.
- Customer Satisfaction – Displays the number of responses received, along with a breakdown of positive, neutral, and negative ratings.
You can narrow down data in the Operations Dashboard using the following filters:
- Group
- Source
Knowledge Base Dashboard
The Knowledge Base dashboard gives you a quick snapshot of the following information:
- Categories, Folders, Articles – High-level structure of the knowledge base.
- Article Feedback – Total number of feedback entries.
- Drafts & In Review – Number of articles still in the writing or approval pipeline.
- Approved & Published – Number of articles ready or already available to customers.
- Article Performance – Views, likes, and dislikes across articles
- My Recent Drafts – Quick access to an agent’s own drafts.
- Articles Awaiting Approval – Articles pending review by editors or admins.

Agent Availability
View the number of agents available, unavailable, or idle at any given moment. Helps managers balance workload and maintain consistent support coverage.

You can see the following statuses in which Agents are:
- Available – Number of agents currently accepting tickets.
- Unavailable – Agents who are offline or unavailable.
- Idle – Agents who are online but not handling any ticket.
Additionally, you can filter the list by status and group or use the search bar to find a specific Agent..
Agent Performance Report
Review productivity metrics for each agent, including assignments, responses, and resolutions. Useful for identifying coaching needs and improving overall team efficiency. Learn more about Agent performance report here.

You can also create up to 15 custom dahsbords by clicking on custom dashboards. Choose from displaying the dashboard to all agents or to select users in a group
 .
.
You can drag and drop the widgets on the right to create your own dashboard.
