
 Community
 Video Library
 Agent Training
 Freshservice
 Freshdesk
 Freshchat
 Freshcaller
 Freshsales
 Freshteam
 Freshworks Neo
 Freshsurvey
 Free
Free Pro
ProAnalytics widgets help you bring charts from Analytics into your Team Dashboards,along with live widgets to monitor key metrics without switching between modules. You can also add charts from existing Analytics reports to your dashboard while preserving the visualization, formatting, and filters configured in Analytics.
For example, you can monitor the following dashboard widgets:
Ticket trends
SLA performance
CSAT metrics
Agent performance
Custom Analytics reports
Prerequisites
Before adding analytics widgets to a Team Dashboard, ensure that:
You have permission to manage Team Dashboards.
You have access to the Analytics module.
The Analytics report containing the widget is available and accessible.
The widget belongs to a public or curated analytics report.
Note:
Analytics widgets display only the data you are authorized to access in Analytics. Different users may see different data in the same widget based on their permissions.
Add Live and Analytics widgets to a Team Dashboard
Go to Dashboards > New Custom Dashboard.
In the pop-up displayed, select permissions for all agents or to select groups.
In the Dashboard canvas, you can add Live or Analytics widgets. The following Live widgets to:
Ticket count - Displays the total number of tickets in a selected ticket view, to help monitor the team's workload in real time.
Ticket distribution - Displays distribution across categories such as ticket properties (For example, Type, Priority, or Status), helping identify trends and areas that require attention.
Customer satisfaction - Displays customer satisfaction (CSAT) metrics to help monitor how satisfied customers are with the team's support over time.
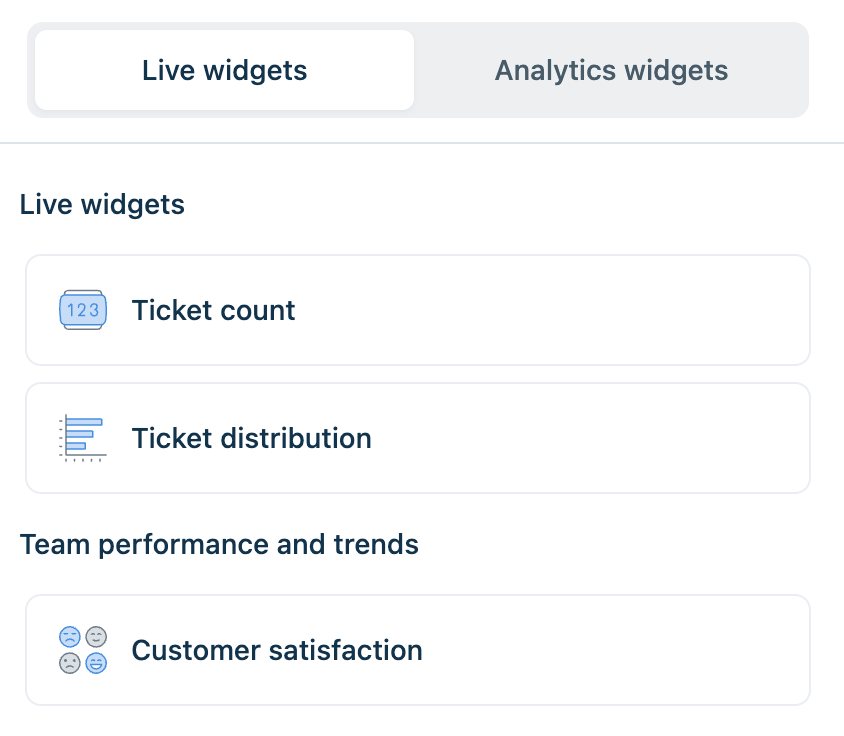
In the Live widgets panel, you can add Ticket count, Ticket distribution, and Customer satisfaction widgets.
Enter a Widget title to rename the widget.
For the Ticket count and Ticket distribution widgets, select the Ticket view to display, such as All tickets, All unresolved tickets, or Urgent and High-priority tickets.
Under Widget highlights, configure threshold values to visually highlight ticket counts:
Alert if greater than: Specify the ticket count at which the widget is highlighted in an alert state.
Critical if greater than: Specify the ticket count at which the widget is highlighted in a critical state.
For the CSAT widget, select the Group whose customer satisfaction data you want to display. Under Time period, select the period for which you want to view the data.
Click Save and back, and then click Save dashboard.
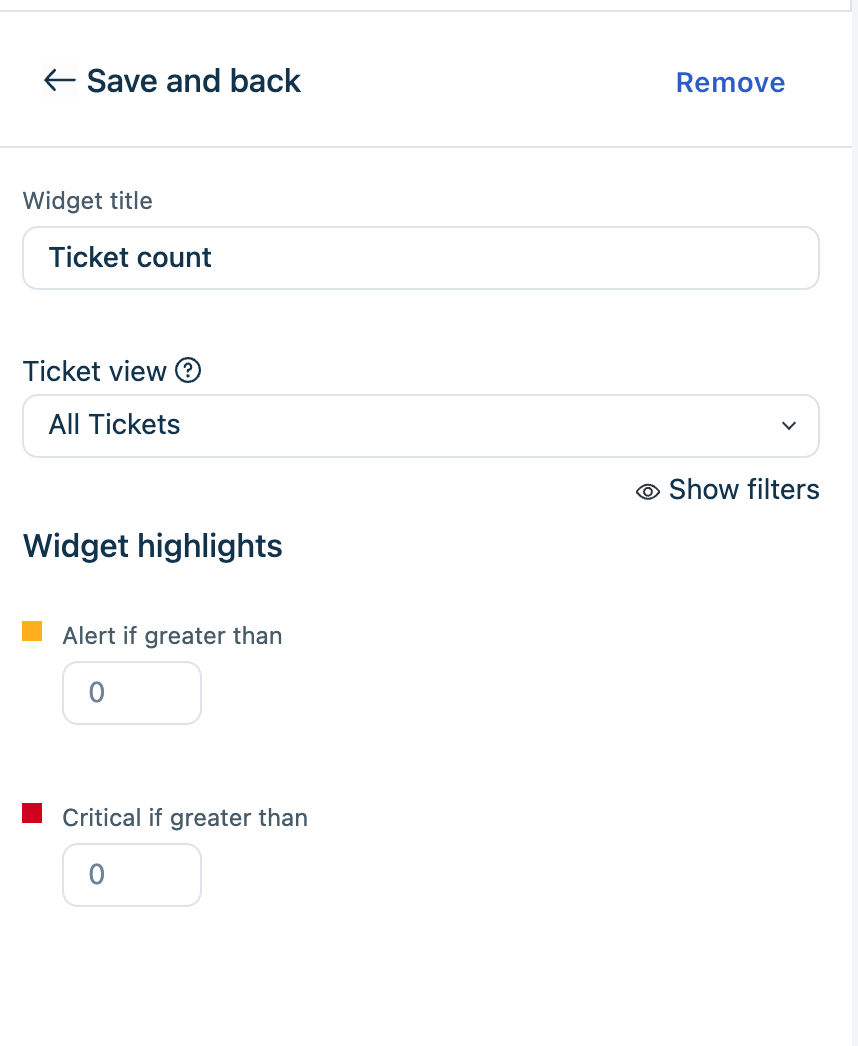
The widgets you add will be displayed in the canvas. Click on a widget to edit it.
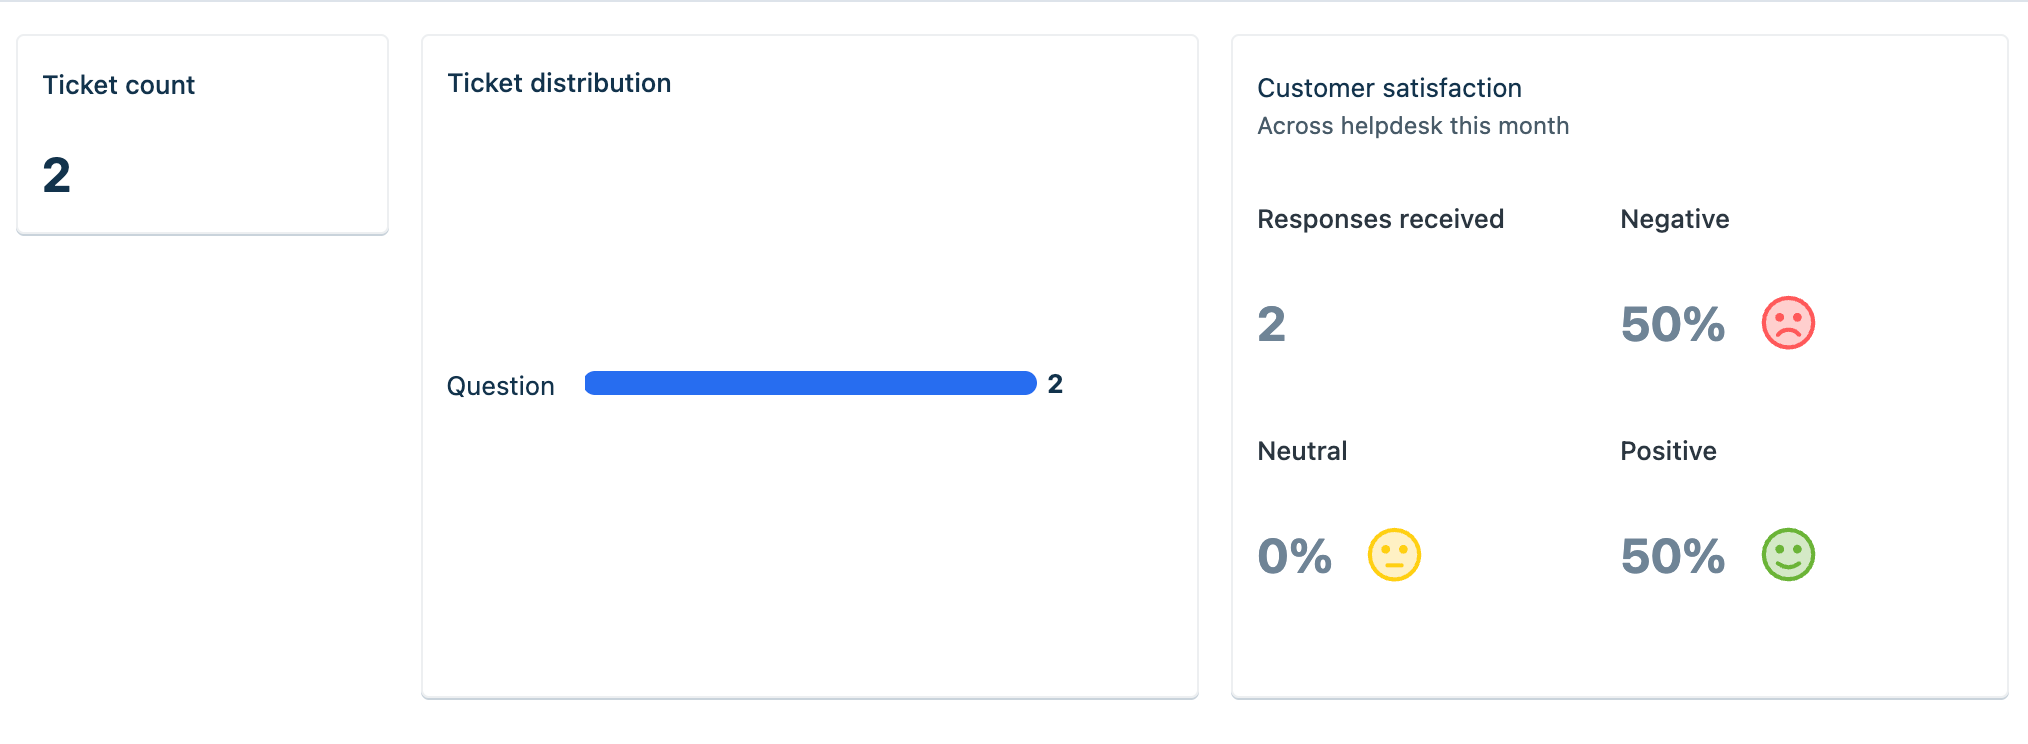
In the Analytics widgets tab, click the Search bar under Reports. The list of reports accessible by the user will be displayed.
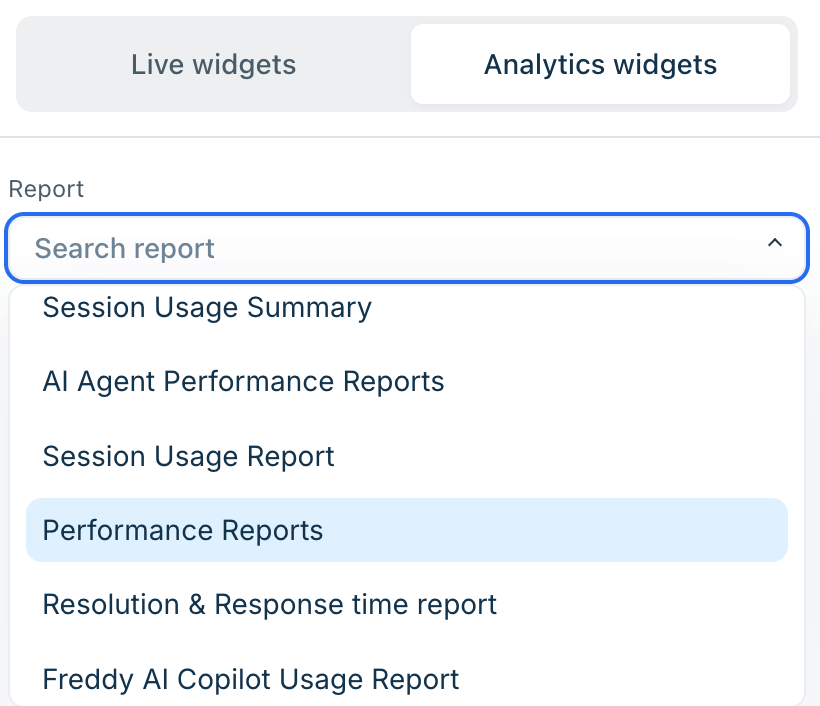
Select the report to add, then click Add near the widgets to add them to the canvas. The widget is added to the dashboard and remains unavailable for selection until it is removed.
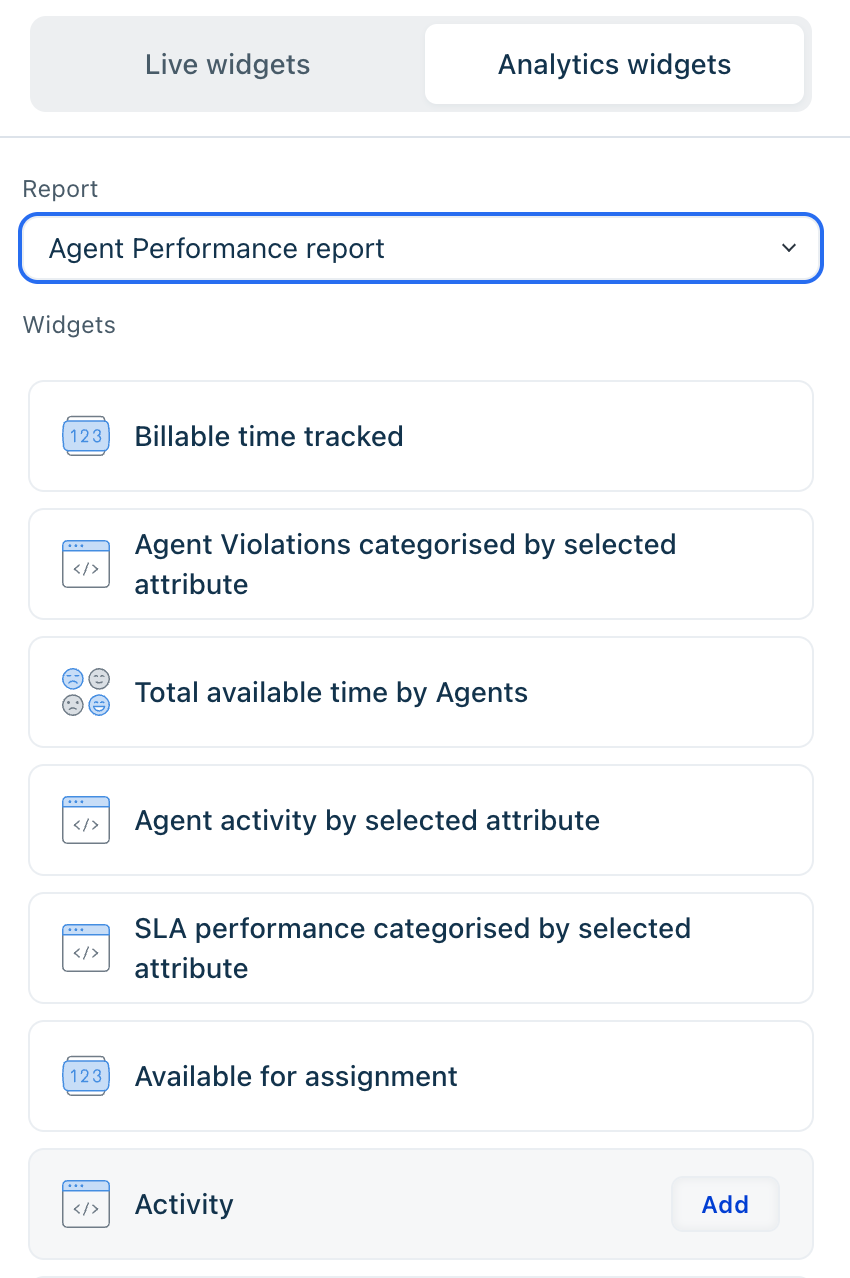
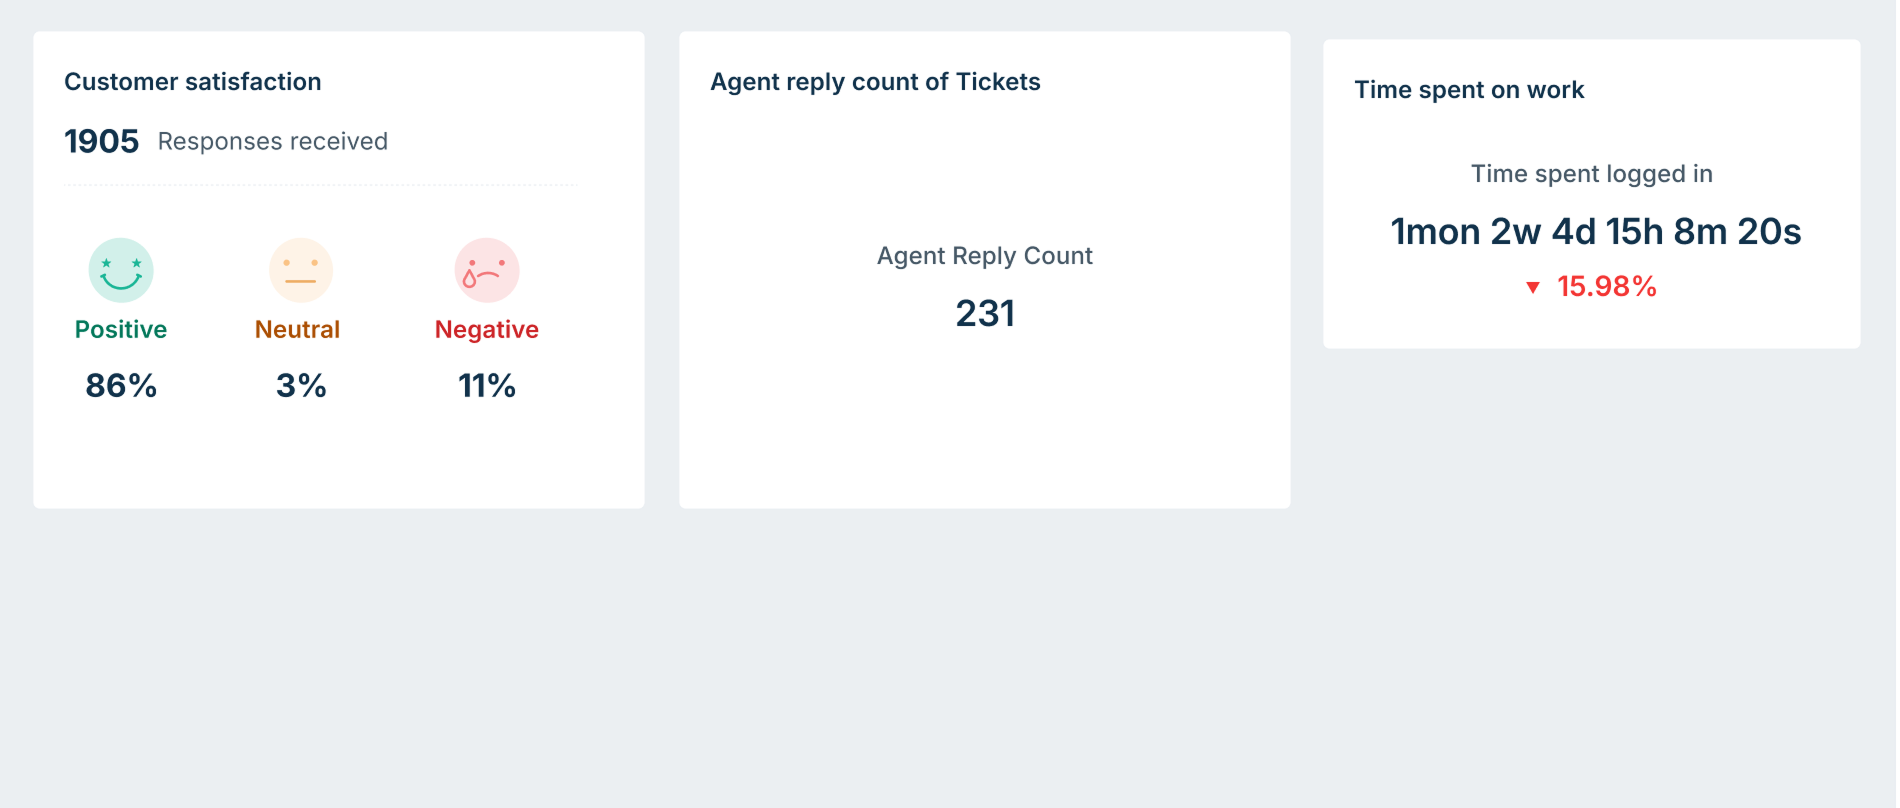
Click Update dashboard.
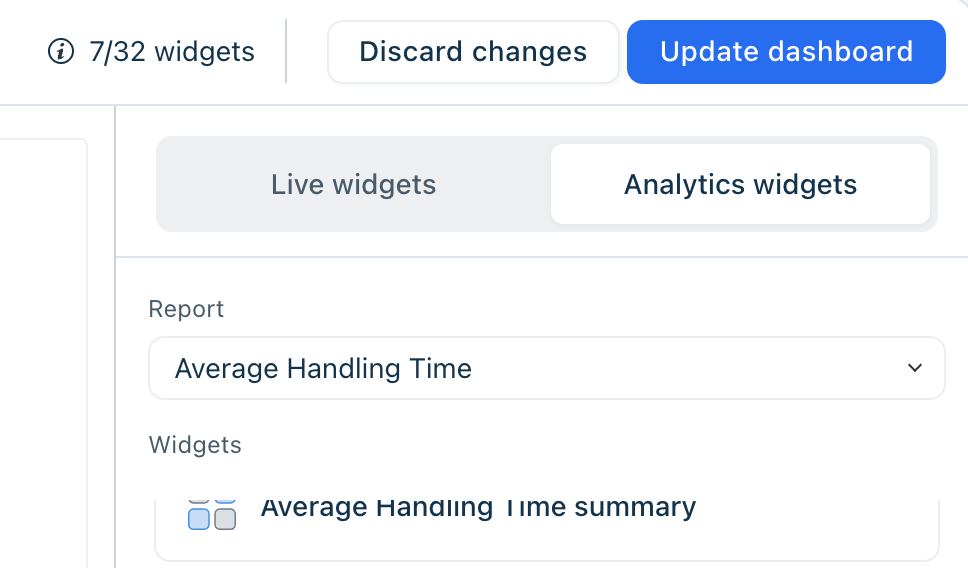
The Analytics widget is added to the Team Dashboard.
Preserved widget formatting
Analytics widgets retain the formatting configured in Analytics, including:
Chart colors
Conditional formatting
Visual styling
This ensures that the widget appears consistently in both Analytics and Team Dashboards.
Widget refresh behavior
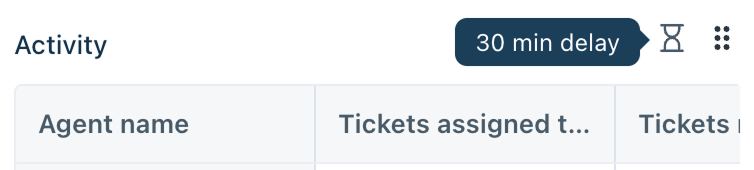
Analytics widgets are refreshed periodically. Dashboard widgets can take up to 30 minutes to reflect the latest Analytics data.
Maximum number of widgets
A Team Dashboard can contain up to 6 Analytics widgets.
When this limit is reached:
The Add option is disabled.
A tooltip explains why additional widgets cannot be added.
After adding Analytics widgets to a Team Dashboard, you can organize your dashboard by repositioning, resizing, or removing widgets. Changes made to the dashboard layout do not affect the underlying Analytics report or widget. Analytics widgets remain read-only within Team Dashboards.
Reposition widgets
You can rearrange Analytics widgets to organize your dashboard based on your monitoring needs.
To move a widget:
Open the Team Dashboard.
Click Edit.
Drag the Analytics widget to the required location.
Click Update dashboard.
View fullscreen
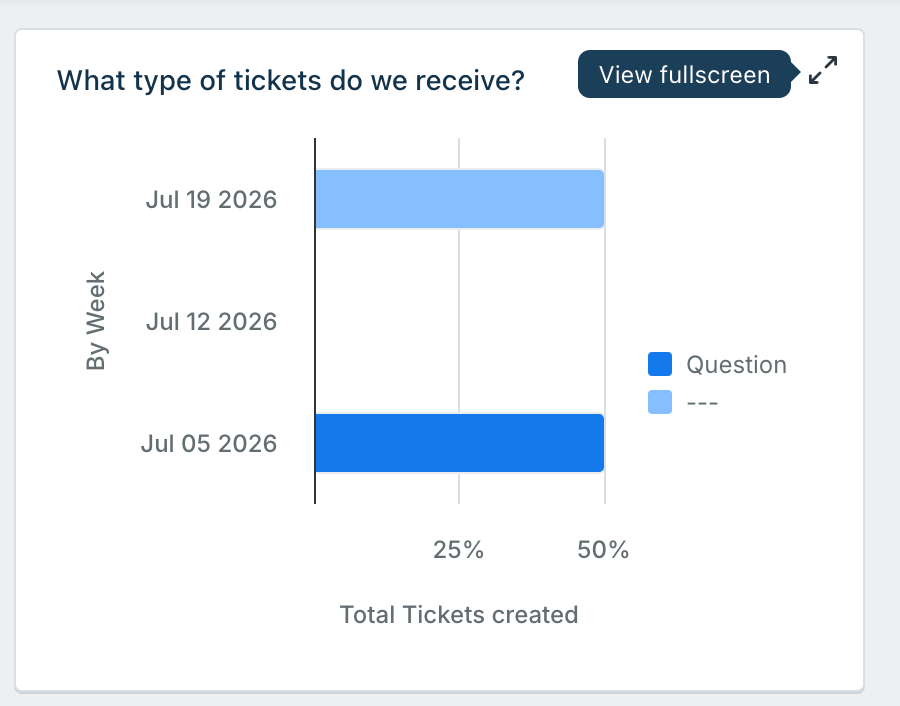
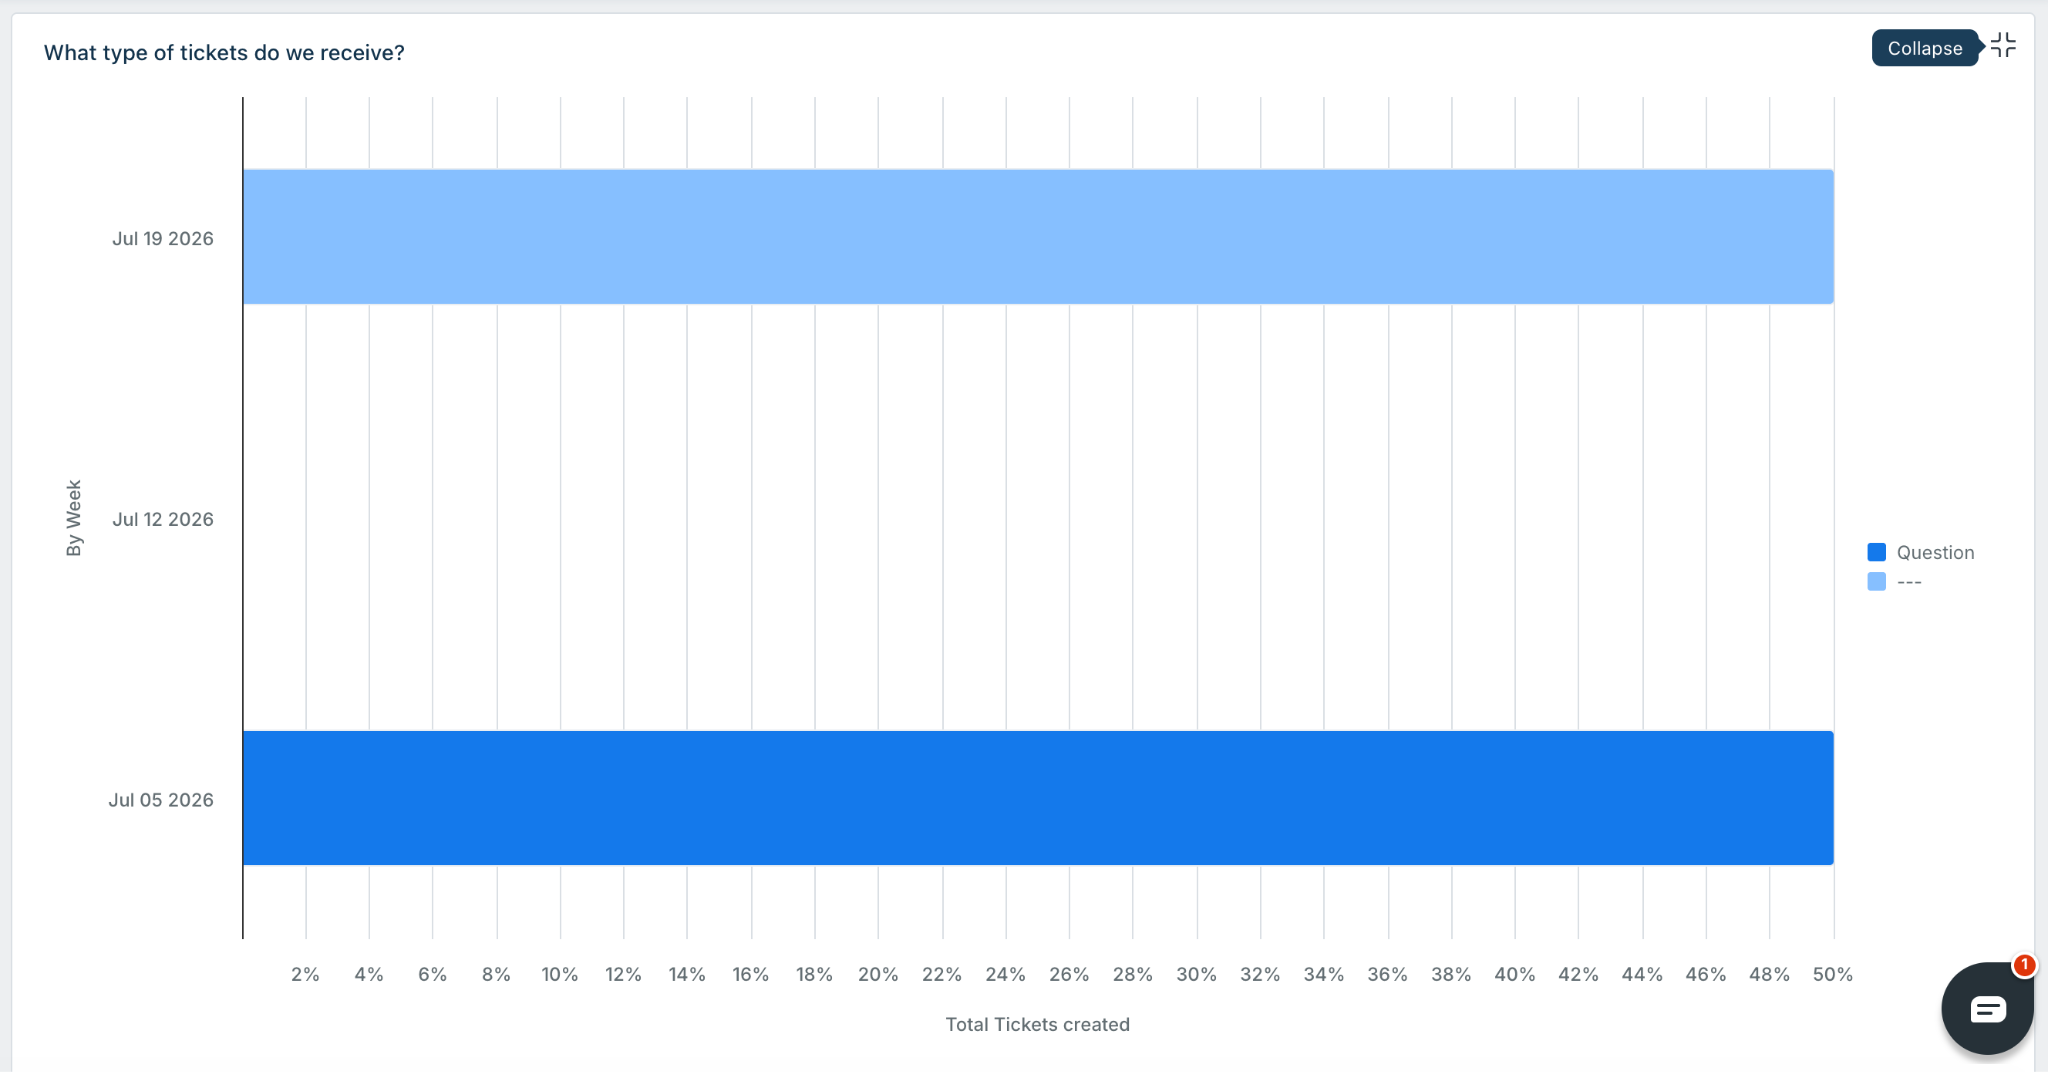
In the read-only mode of the dashboard, click View fullscreen to view the widget bigger.
Click the Collapse icon to go back to original size of the widget.
Remove widget
Removing an Analytics widget only removes it from the Team Dashboard. The original Analytics report and widget remain unchanged.
To remove a widget follow these steps:
Open the Team Dashboard.
Click Edit.
Select the Analytics widget.
Click Remove.
Confirm the action.
The widget is removed from the dashboard and becomes available again in the Analytics widgets panel.
Edit widget
Analytics widgets are read-only when added to Team Dashboards.
You cannot modify the following widgets:
Widget metrics
Filters
Grouping
Chart configuration
Widget title
To make changes, update the widget in Analytics. If required, remove the existing widget from the dashboard and add it again.
Important:
Team Dashboards are designed for monitoring. Analytics remains the source for creating and editing reports and widgets.
Permissions and data access
Your ability to add or manage Analytics widgets depends on your Team Dashboard and Analytics permissions.
Analytics widgets always respect your Analytics permissions.
For example:
Agents with group-level access see data only for their assigned groups.
Agents with restricted ticket access see only the tickets they are authorized to view.
Administrators may see additional data based on their Analytics permissions.
As a result, different users may see different data in the same Analytics widget.
What happens if a report or widget is unavailable?
If the source Analytics report or widget is no longer available, the dashboard cannot display the widget. In this case, the appropriate error message will be displayed. Remove the unavailable widget from the dashboard and add another Analytics widget if required.
Best practices
To improve dashboard usability:
Use Team Dashboards for frequently monitored metrics.
Organize related Analytics widgets together.
Reserve Analytics reports for detailed analysis and filtering.
Remove widgets that are no longer required to stay within the dashboard widget limit.
Periodically review dashboards to ensure linked Analytics reports are still available.
Limitations
Keep the following limitations in mind when using Analytics widgets on Team Dashboards.
A Team Dashboard can contain a maximum of 32 widgets, including both Live widgets and Analytics widgets.
Dashboard widgets may take up to 30 minutes to reflect the latest Analytics data.
Dashboard widgets display data based on each user's Analytics permissions. Different users may see different results for the same widget.
Troubleshooting
FAQs
Can I edit an Analytics widget from a Team Dashboard?
No. Analytics widgets are read-only when displayed on Team Dashboards.
To change the chart, filters, metrics, or visualization, edit the widget in Analytics.
Can I add widgets from any Analytics report?
No. The widgets accessible to you in the Analytics module will be displayed.
Why do different users see different data in the same widget?
Analytics widgets respect Analytics permissions.
Users see only the data they are authorized to access.
Does removing a widget delete it from Analytics?
No. Removing a widget only removes it from the Team Dashboard. The original Analytics report and widget remain unchanged.
Can I add the same Analytics widget multiple times?
No. Once an Analytics widget has been added to a Team Dashboard, it is unavailable for selection until it is removed from that dashboard.